In accordance with the Protection of the Environment Legislation Amendment Act 2011 (POELA Act), we are required to publish a monthly summary of our Environment Protection Licence (EPL) data and provide information on licence exceedance.
- Licence holder: EnergyAustralia NSW Pty Ltd
- Licence number: 13007
- EPL: EPL13007 Licence Summary
These requirements aim to better inform the public and provide the community access to Mount Piper’s operational performance.
Mt Piper has a Pollution Incident Response and Management Plan for the power station and surrounding areas.
Download NSW EPA reports
Previous Mt Piper EPA reports are available upon request.
| Year | Month | Reports |
|---|---|---|
| 2020 | ||
| 2021 | ||
| 2022 | ||
| 2023 | ||
| 2024 | ||
| 2025 | ||
| 2026 |
Units of Measurement for Environment Protection Licence Number 13007
| Unit of measure abbreviation | Unit of measure |
|---|---|
| % | percent |
| µS/cm | microsiemens per centimetre |
| dB(A) LAeq (15 minute) | decibel dB(A) LAeq (15 minute) |
| g/g mole | grams per gram mole |
| g/m3 | grams per cubic metre |
| kg/m3 | kilograms per cubic metre |
| m/s | metres per second |
| m3 /s | cubic metres per second |
| mg/L | milligrams per litre |
| mg/m3 | milligrams per cubic metre |
| kL | Kilolitre |
| NTU | nephelometric turbidity units |
| oC | degrees Celsius |
| pH | pH |
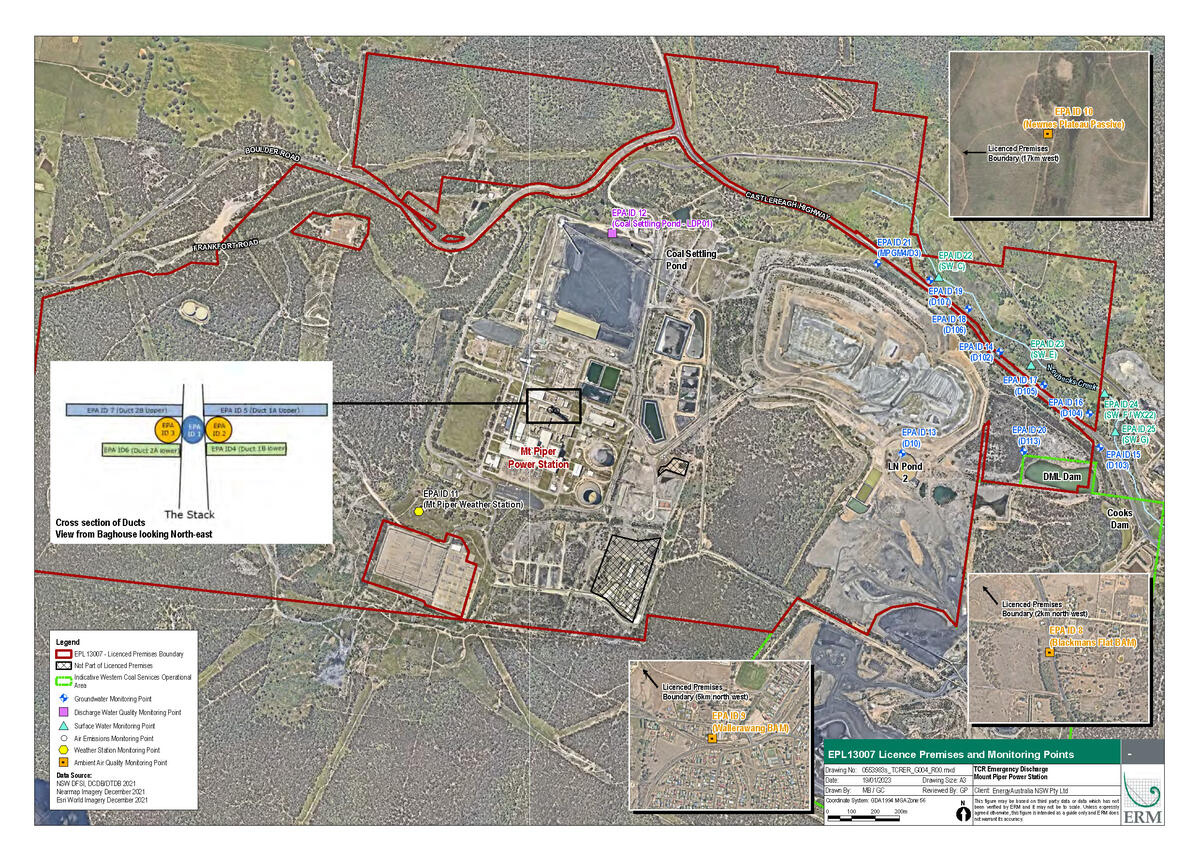
Air Emission and water discharge monitoring locations
| EPA Identification no. | Type of Monitoring Point | Type of Discharge Point | Location Description |
|---|---|---|---|
| 1 | Discharge to air | Discharge of air emissions from Mt Piper Stack serving Boilers 1 and 2 marked and shown as EPA ID 1 on The Plan | |
| 2 | Air emission monitoring |
Discharge of combined air emissions from Boiler 1 via points 4 and 5 to point 1 marked and shown as EPA ID 2 on The Plan |
|
| 3 | Air emission monitoring | Discharge of combined air emissions from Boiler 2 via points 6 and 7 to point 1 marked and shown as EPA ID 3 on The Plan | |
| 4 | Air emission monitoring | Boiler number 1 exhaust - Duct B marked and shown as EPA ID 4 (Duct 1B) on The Plan | |
| 5 | Air emission monitoring | Boiler number 1 exhaust - Duct A marked and shown as EPA ID 5 (Duct 1A) on The Plan | |
| 6 | Air emission monitoring | Boiler number 2 exhaust - Duct A marked and shown as EPA ID 6 (Duct 2A) on The Plan | |
| 7 | Air emission monitoring | Boiler number 2 exhaust - Duct A marked and shown as EPA ID 7 (Duct 2B) on The Plan | |
| 11 |
Meteorological weather monitoring |
Weather station as indicated as EPA ID 11 (Mt Piper Weather Station) on the plan | |
| 12 |
Discharge to waters |
Discharge to waters |
Overflow from CHP Settlement Basin marked as "weir" at EL931 on Figure 4 of the Aurecon CHP Coal Settling Basin Water Management Options Report Ref: 501396 21 August 2018 (EPA reference DOC18/644531). |
Map including surface and ground water monitoring locations
The Annual Air Emission Monitoring Report (AAEMR) is prepared and submitted each year with the Annual Return. The AAEMR includes tabulated and graphical results of all periodic and continuous monitoring data form the reporting period. Data is trended and compared against results from the previous four years. The AAEMR demonstrates that the air emissions and monitoring is representative of typical operating conditions at the Mt Piper Power Station. It demonstrates compliance with the Continuous Emission Monitoring System (CEMS) Quality Assurance and Control Procedures and summarises the total consumption of coal.
The Coal Ash Monitoring Report (CAMR) has been prepared in accordance with EPL 13007, Condition R4.4 and details the information required under Condition M9.1. The CAMR is included in Section 1.2 and Section 5 of the AAEMR.
| Year | Report |
|---|---|
| 2023 | |
| 2024 | |
| 2025 |